In case you were wondering what effect Obama’s health care legislation (Affordable Care Act) will have on Medicare (’cause I’m sure everyone was wondering this), I have some visual aids for you. I create these for my Introduction to Sociology class for the chapter on aging. But the change was so dramatic I figured others might want to see what is going to happen.
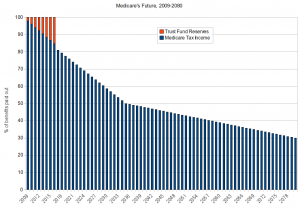
In the 2009 report by the Social Security Administration, they reported that medicare was already paying out more than it was receiving in taxes, but the trust fund and interest on the trust fund were making up for the shortfall. However, the trust fund assets would have been exhausted by 2016, at which point the amount that would be paid out to those making claims on medicare would be about 81% of what they were supposed to get, and that percentage would drop down to about 50% by 2036, then continue to fall to about 30% by 2080. This is depicted in the figure below.

The blue bars indicate how much would be paid out and the red indicates the use of trust fund reserves and interest that would be used to make up the shortfalls in taxes.
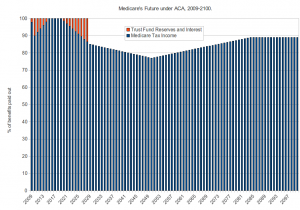
With the passage of the Affordable Care Act in 2010, the picture changes dramatically (per the Social Security Administration’s report). Now, while we are currently in a shortfall and using reserves and interest, there will actually be a surplus from 2015 through 2019 (when the recession ends), at which point we’ll again have a deficit. Trust fund reserves will be used up by 2028 or so, but people will still receive about 84% of what they are supposed to. That will decline to 77% by 2050, then climb again to 89% by 2084. Here’s how things look graphically:

Whether you agree with the legislation or not, it’s hard to argue that it didn’t go at least some way toward addressing the problems facing Medicare.
![]()
Leave a Reply