Category: technology
-

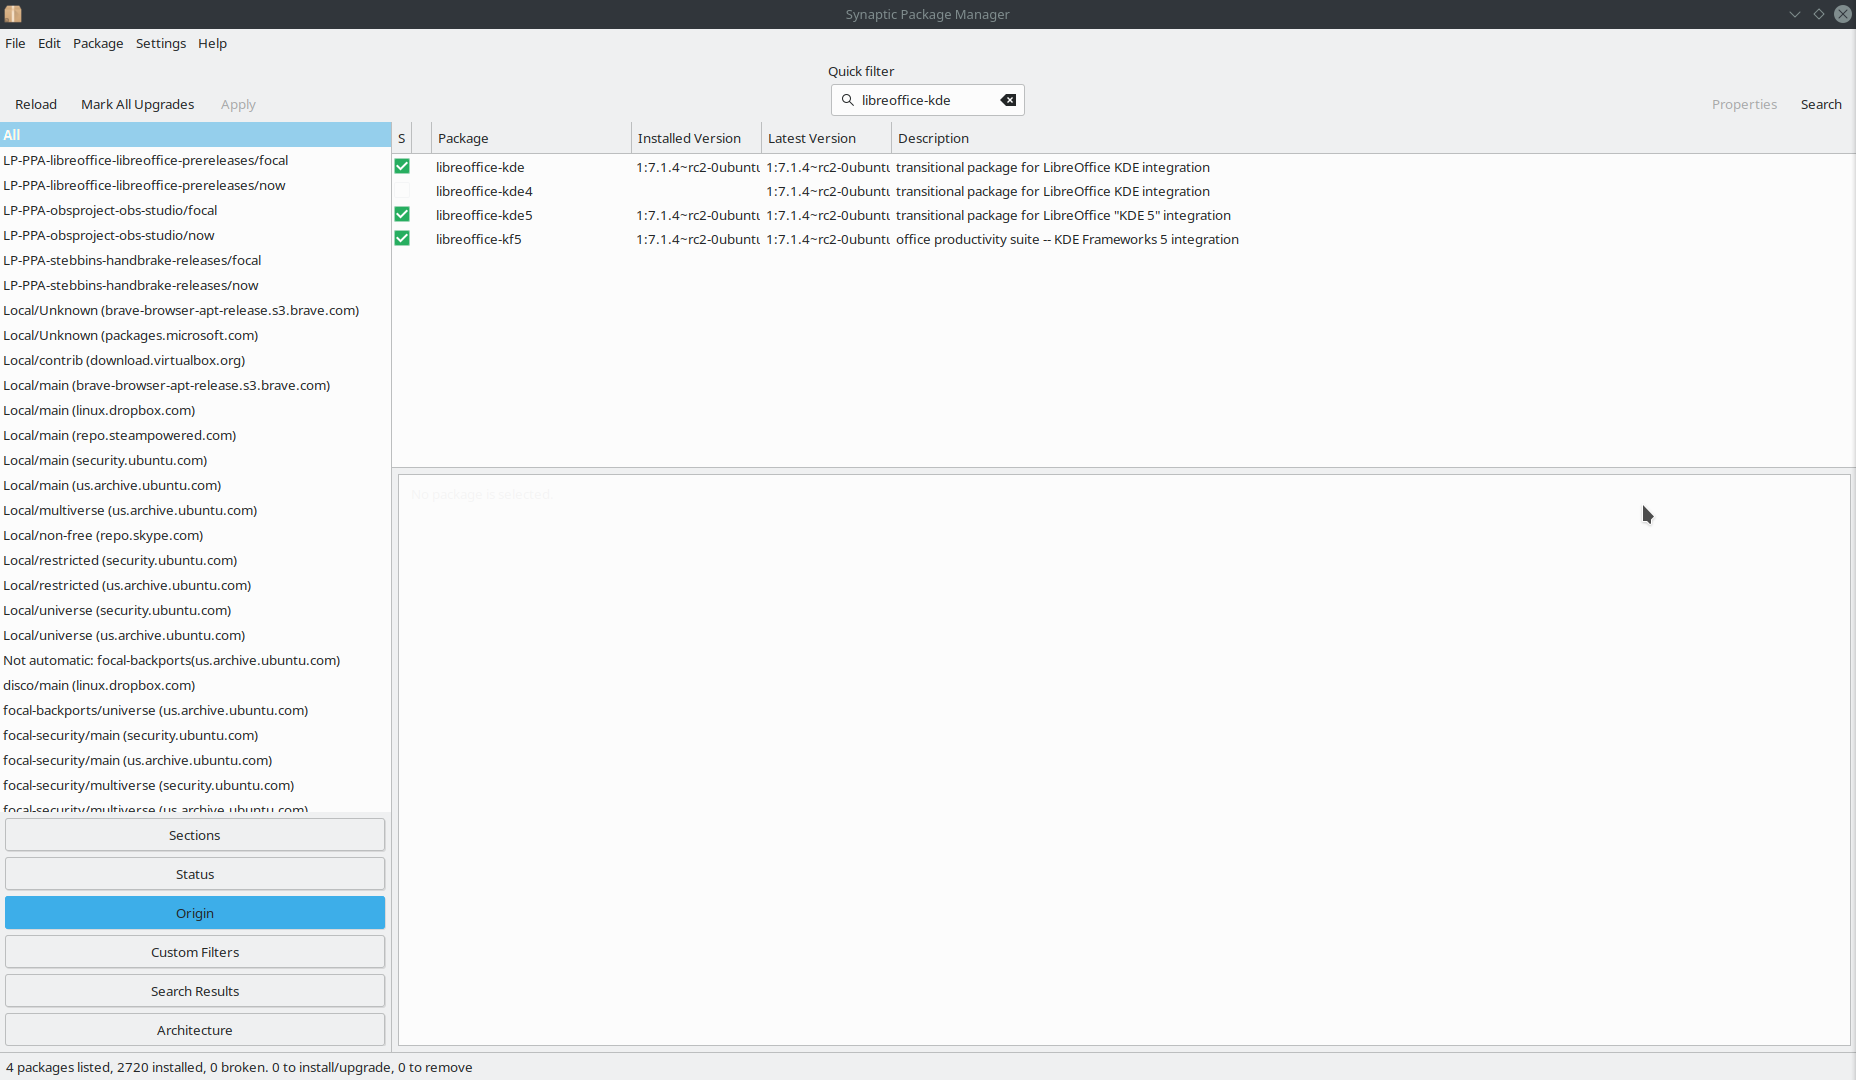
Linux Server – tar files and directories
I recently had to move all my websites from one virtual private server (VPS) to another. When I only had a few such websites, I was okay with using SFTP (via Filezilla) to download all of the files and then upload them to the VPS. It took a while but I was okay with that.…
-

ASUS Router – VPN with Android phone
I have a specific use scenario where I need to be on my home network to control a device but may want to control that device when I’m not home. After considering several options, I realized that my newly purchased ASUS router – ASUS AX6000/RT-AX88U – has the ability to create a VPN. Rather than…
-
Plex – Export Playlists to M3U
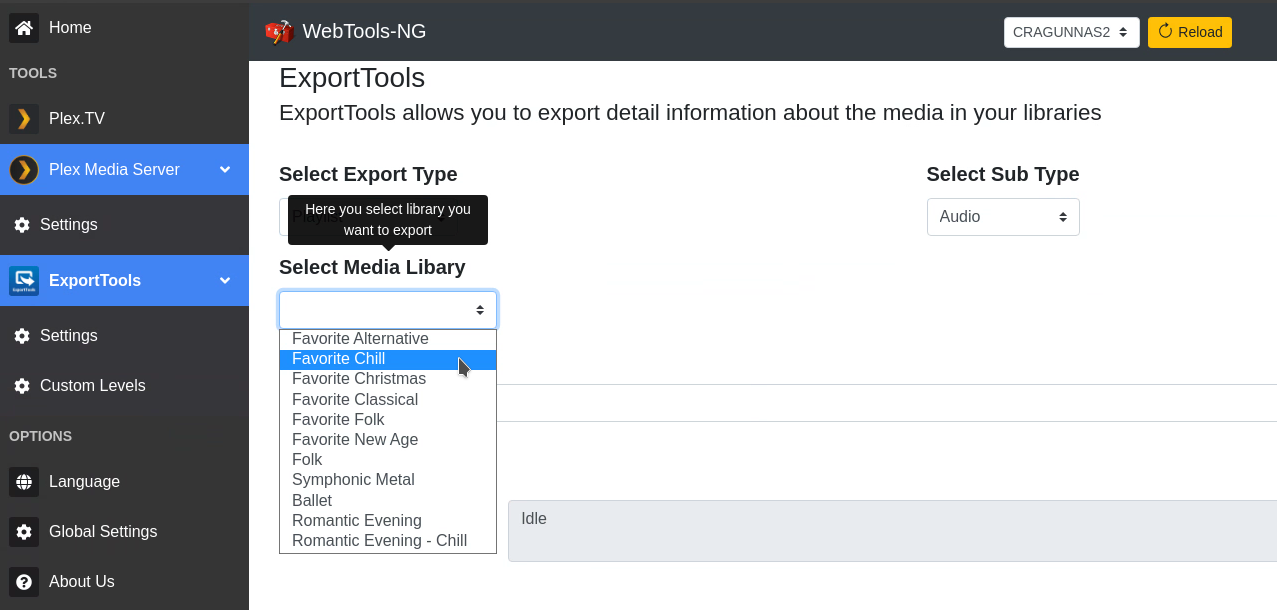
I spent the last year or so cleaning up my music library. It is now organized how I want it to be. I use two software packages to play my music. At home, on my primary computer, I use Clementine (which is also partly how I organized my library). When I’m away from home, I…
-
Linux Server – Adding a New Domain and WordPress Site – Linode VPS – Ubuntu 18.04
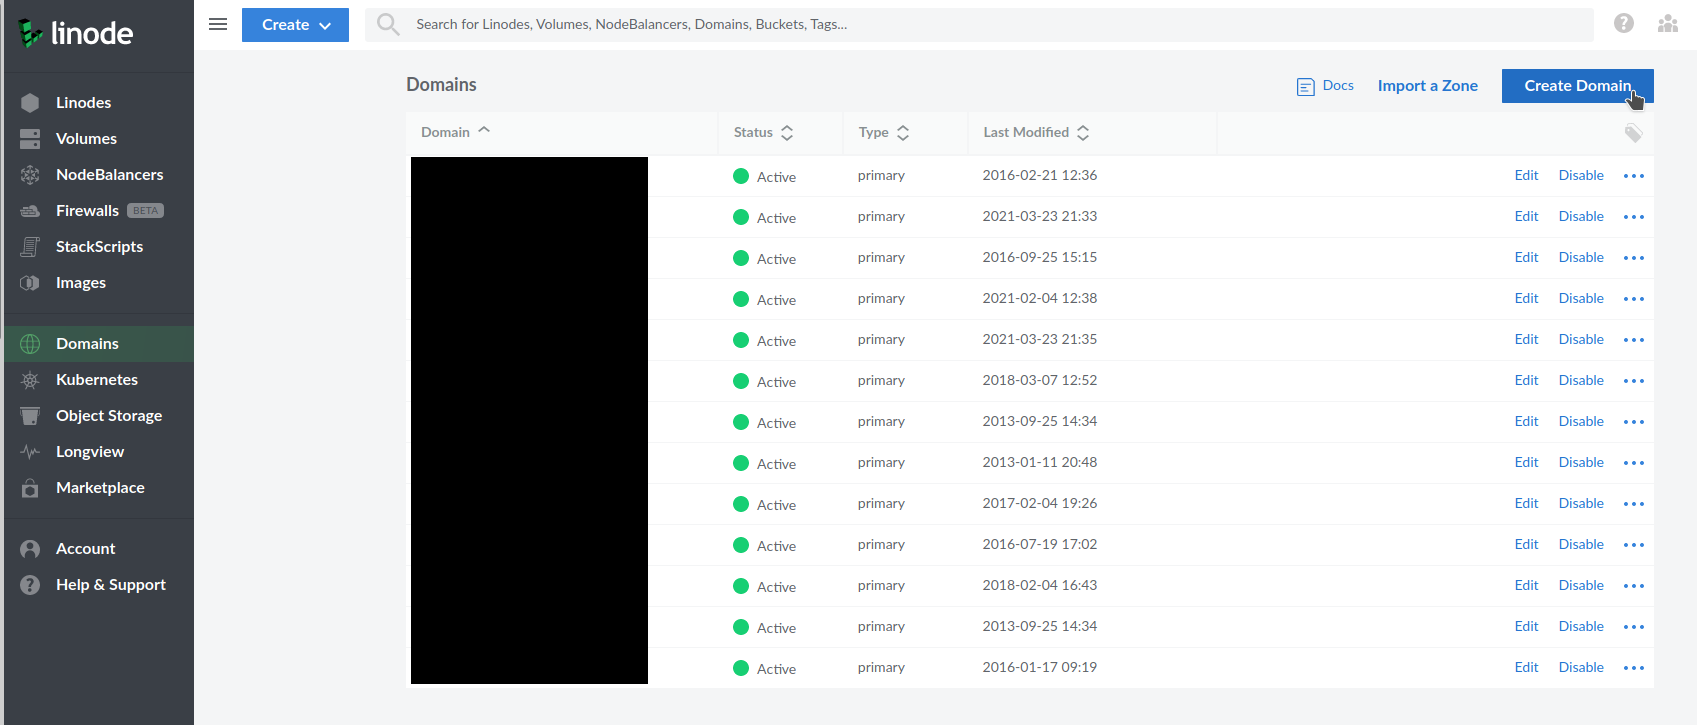
I have a VPS server with Linode that I use to host about a dozen different websites. All but one of them run on WordPress. Occasionally, I get a request to add another domain and website to the server. It’s not terribly time consuming to do, but it does require a number of specific steps…
-
GPRENAME – removing text up to a space using regular expressions
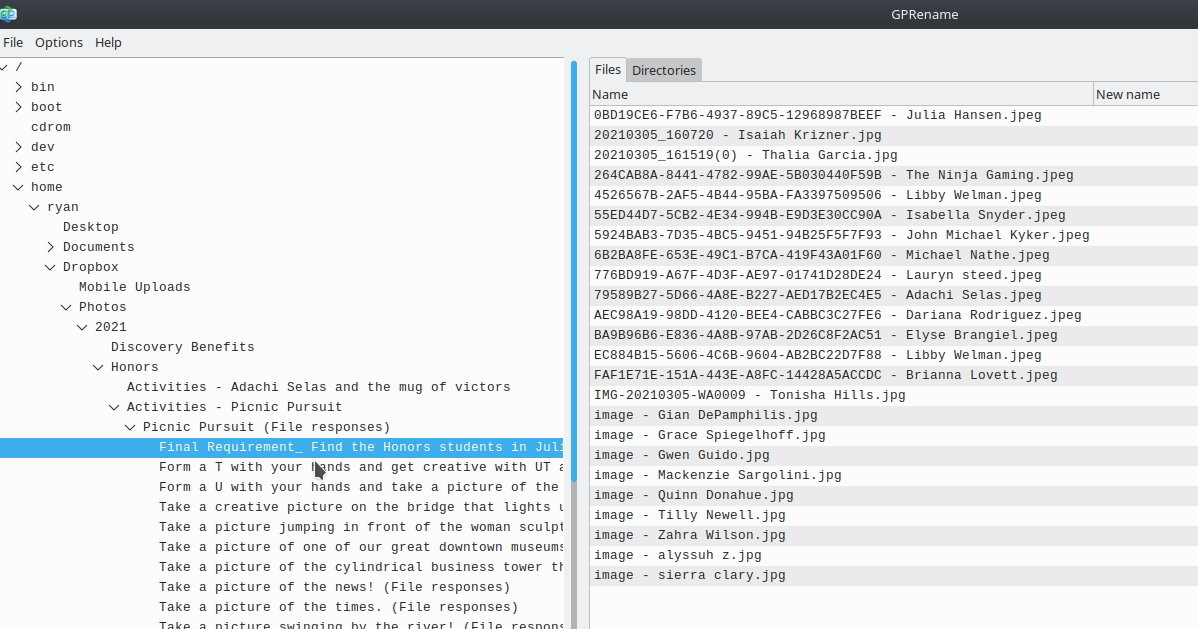
For a recent project, I came into possession of hundreds of photos, each of which was named according to the settings the person who take the photo with their phone had in place but ended with ” – FirstName LastName.jpg.” I wanted to keep the users’ names, but everything before that could go. With hundreds…
-

ZFS Snapshot Management
With my new fileserver/NAS, I am using a ZFS raid array for my file storage. One aspect of the ZFS file system that I didn’t really investigate all that closely before I installed it was the snapshot feature. ZFS snapshots basically store a “picture” or “image” of all the files on the system at a…
-
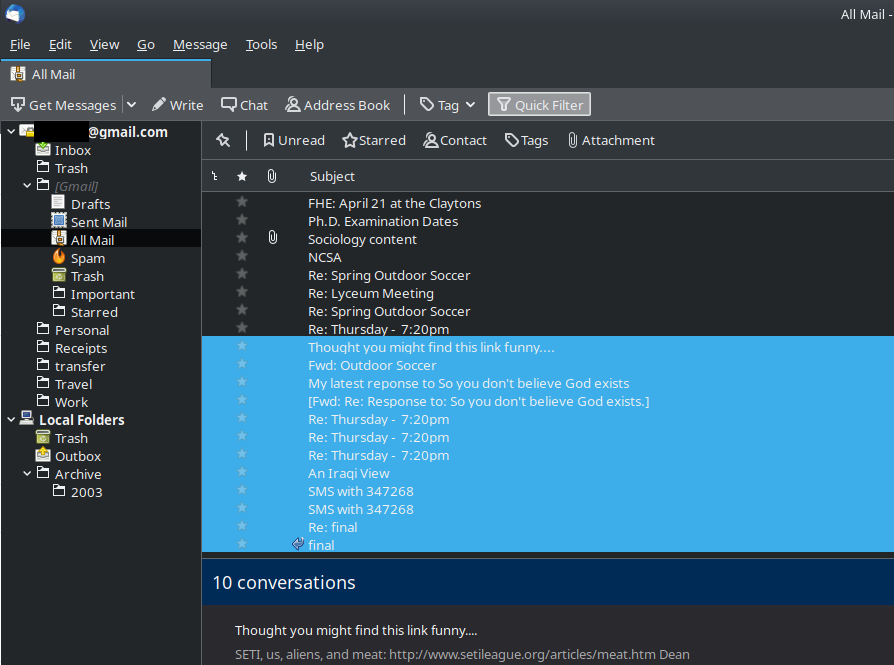
Long Term Storage of Gmail/Email using Mozilla’s Thunderbird (on Linux)
I have email going back to 2003. There have been times when I have actually benefited from my email archive. Several times, I have gone back 5 or more years to look for a specific email and my archive has saved me. However, my current approach to backing up my email is, let’s say, a…
-
Linux – Bulk UnRAR
If you’re not familiar with RAR files, they are like ZIP files. RAR is an archive format. I had a collection of more than 150 RAR files in a single folder I needed to unrar (that is, open and extract from the archive). Doing them one at a time via KDE’s Ark software would work,…
-
Linux: Batch Convert .avi files to .mp4/.mkv
I’ve been trying to clean up my video library since building my latest NAS. In the process, I found a number of .avi files, which is an older file format that isn’t widely used these days. While every time a file is converted it loses some of its quality, I was willing to risk the…
