Travel, Tech, Thoughts…
-
Pickens, SC – Hiking Trip – Day 7 – movie marathon
It was supposed to rain on our last day of our trip to South Carolina. Our plan was to spend the day inside playing games and watching movies. It took us all day, but we managed to finish all of the extended versions of The Lord of the Rings trilogy, which is close to 12…
-
Pickens, SC – Hiking Trip – Day 6 – Table Rock
We saved our longest hike for last. Perhaps the most well-known and scenic hike in the area near our cabin is Table Rock Trail. This leads to the top of a mountain and then, just past the summit, to a beautiful overlook. Despite the trail being well-worn and marked with red blazes, we actually lost…
-
Pickens, SC – Hiking Trip – Day 5 – Falls Creek Waterfalls
Our friends left early in the morning so it was just the three of us again. We opted for a hike to another waterfall – Falls Creek Waterfalls. It’s not the best name, but the waterfalls were, again, quite beautiful. Some of the trip reports for this hike suggested the trail was quite steep and…
-
Pickens, SC – Hiking Trip – Day 4 – Rainbow Falls
Following the same pattern, we got up fairly early to do another hike – Rainbow Falls. This one was in the Jones Gap State Park, which does require a $6 parking fee per person (kids and seniors are less). The hike was to Rainbow Falls. Here’s the route: Per my watch, the route was 5.01…
-
Pickens, SC – Hiking Trip – Day 3 – Twin Falls Trail
With our friends from North Carolina joining us, we headed out for our second hike – Twin Falls Trail on Reedy Cove Creek. This one was a little weird as it isn’t part of a state park, so the parking for the beginning of the trail was really just a pull out on the side…
-
Pickens, SC – Hiking Trip – Day 2 – Raven Rock Loop Trail
The plan was to do a hike every morning while it was cooler, then head back to the cabin and relax, playing games, watching movies, cooking, and chatting. We also had some friends who live in North Carolina who were going to visit for a couple of days. Our first hike was the Raven Rock…
-
Pickens, SC – Hiking Trip – Day 1
Since March 2020, we have been cooped up pretty consistently thanks to the COVID-19 pandemic. We have gone out to shop and exercise, but that’s about it. After nearly 5 months of hardly leaving the house, we were getting a little antsy. We eventually came up with a trip that we thought would work well…
-
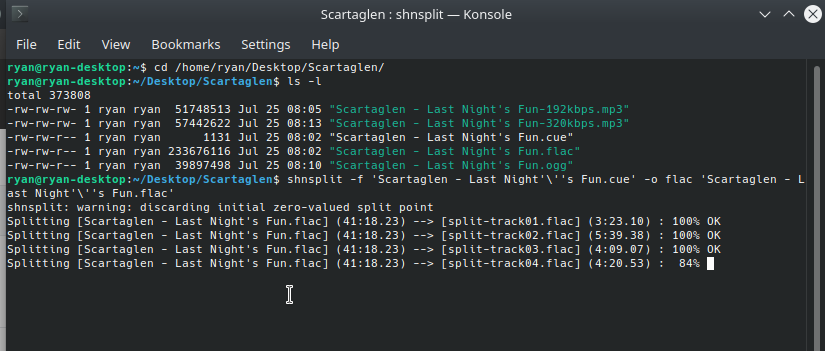
Kubuntu – Audio CD Ripping
I mostly buy digital audio these days. My preferred source is bandcamp as they provide files in FLAC (Free Lossless Audio Codec). However, I ended up buying a CD recently (Last Night’s Fun by Scartaglen) as there wasn’t a digital download available and, in the process, I realized that there are lots of options for…
-
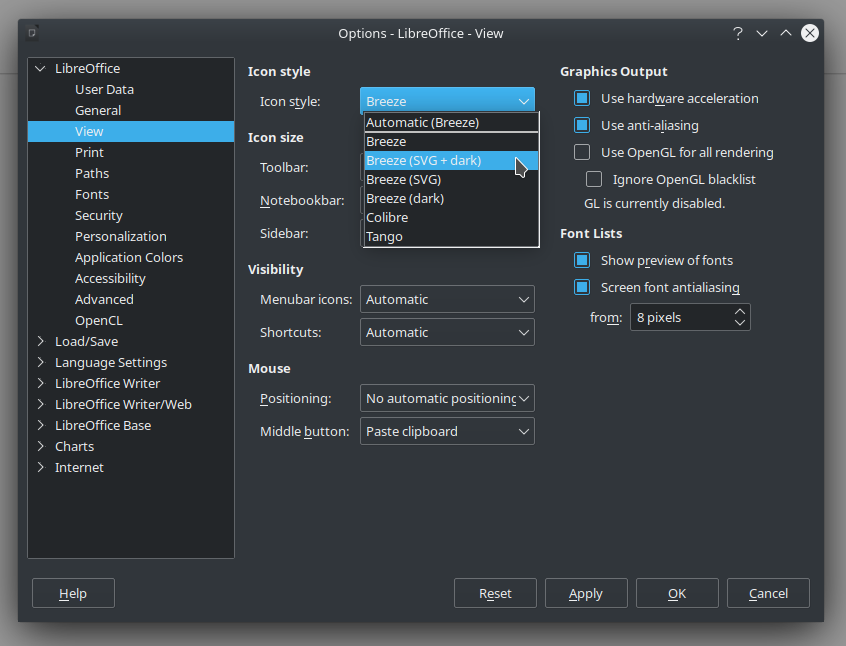
LibreOffice – How To Change Icons to a Darker Theme
I prefer darker themes for my desktop environment (Kubuntu 20.04) and browser (Brave). For the most part, this isn’t a problem, but it does cause an issue with some applications, including LibreOffice (6.4.4.2). One of the first things I do when I install Kubuntu is switch my desktop environment from the default theme (System Settings…
-

Hillsborough County, FL – Fall 2020 Primary
In researching candidates for elections, I have taken to posting links to the information I find on my website to help others. Note, I’m a registered Democrat only so I can vote in the Democrat primaries. I would prefer to be considered an Independent voter as I vote by the candidate, not by party. Here’s…