Tag: LibreOffice charts with different scales
-
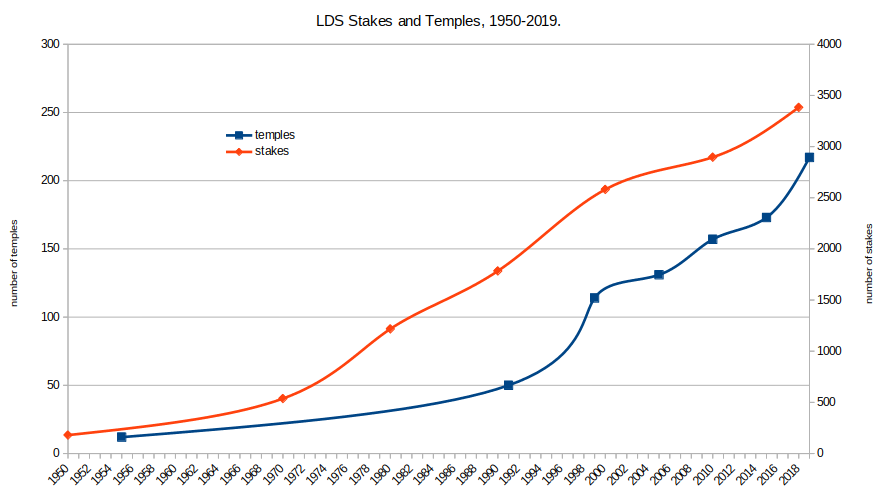
LibreOffice Calc: Graphs with Two y-axes with Different Scales
While a bit technical, it’s occasionally useful to plot multiple data series that have very different scales in the same chart. Let me give an example to illustrate. Let’s say I want to see whether the number of Mormon temples being built aligns with the number of Mormon stakes (akin to a Catholic diocese) that…